官方保障|直连原生正版模型,稳定、不降智、不掺水!所有 Pro 计划限时特惠!
立即开通
image2.vip
首页
灵感
教程
价格
API & Skills
返回灵感广场
1 / 1
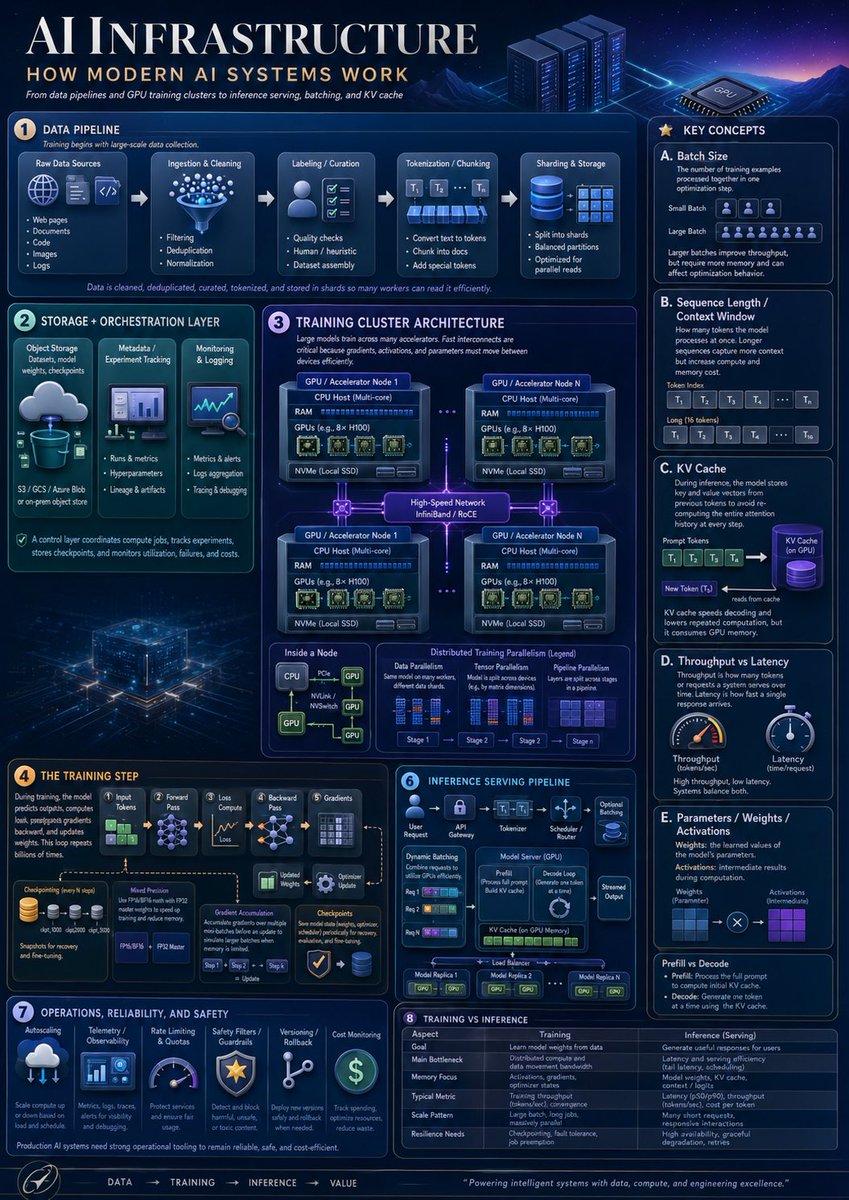
AI基础设施
案列来源:ben.oi 🌐
信息图 & PPT
openai/gpt-image-2
#信息图
#海报
#竖版 9:16
#UI 设计
#赛博朋克
解释现代AI系统的教育信息图,适合技术演示和学习材料。
6.3w
人正在用
4:5
推荐尺寸
2.9w
收藏人数
提示词模板
复制全文
Goal: Create a highly polished vertical educational infographic titled {argument name="headline text" default="AI INFRASTRUCTURE"} with the subtitle {argument name="subtitle text" default="HOW MODERN AI SYSTEMS WORK"}, explaining modern AI infrastructure from data pipelines and GPU training clusters to inference serving, batching, and KV cache. Canvas: Vertical poster, 4:5 aspect ratio, dark navy futuristic data-center aesthetic. Use a glowing blue/purple cyber grid background with mountains, server racks, a GPU chip illustration, neon circuit traces, thin rounded panels, white and cyan typography, and small orange numbered badges. The overall look should resemble a premium technical explainer poster, dense but readable. Layout: Large title across the top left, small subtitle and tagline below it, decorative server racks and GPU chip on the top right. Arrange the content into exactly 8 numbered main sections plus a right-side “Key Concepts” column and a bottom flow footer. Use precise panel borders, small icons, arrows, diagrams, tables, and micro-labels. Sections and required content: 1. Data Pipeline: Show exactly 5 pipeline stages connected by arrows: Raw Data Sources, Ingestion & Cleaning, Labeling / Curation, Tokenization / Chunking, and Sharding & Storage. Raw Data Sources contains exactly 5 bullets: Web pages, Documents, Code, Images, Logs. Ingestion & Cleaning contains exactly 3 bullets: Filtering, Deduplication, Normalization. Labeling / Curation contains exactly 3 bullets: Quality checks, Human / heuristic, Dataset assembly. Tokenization / Chunking contains exactly 3 bullets: Convert text to tokens, Chunk into docs, Add special tokens. Sharding & Storage contains exactly 3 bullets: Split into shards, Balanced partitions, Optimized for parallel reads. Add a caption stating that data is cleaned, deduplicated, curated, tokenized, and stored in shards so many workers can read it efficiently. 2. Storage + Orchestration Layer: Include exactly 3 vertical cards: Object Storage with a cloud-to-database icon and note “S3 / GCS / Azure Blob or on-prem object store”; Metadata / Experiment Tracking with a dashboard icon and bullets “Runs & metrics,” “Hyperparameters,” “Lineage & artifacts”; Monitoring & Logging with a chart/magnifier icon and bullets “Metrics & alerts,” “Logs aggregation,” “Tracing & debugging.” Add a footer note that the control layer coordinates compute jobs, tracks experiments, stores checkpoints, and monitors utilization, failures, and costs. 3. Training Cluster Architecture: Large central architecture diagram titled Training Cluster Architecture. Show exactly 4 GPU / Accelerator Node boxes in a 2x2 grid connected by glowing high-speed network links labeled “High-Speed Network InfiniBand / RoCE.” Each node contains CPU Host (Multi-core), RAM, GPUs such as 8x H100, and NVMe local SSD. Add dotted links between nodes. Below, include exactly 3 mini-panels: Inside a Node, Data Parallelism, and Distributed Training Parallelism (Legend). Inside a Node should show CPU connected by PCIe/NVLink/NVSwitch lines to multiple GPUs. Distributed Training Parallelism legend should show exactly 4 stages labeled Stage 1, Stage 2, Stage 3, Stage 4. 4. The Training Step: Create a left-to-right training flow with exactly 6 stages: Input Tokens, Forward Pass, Loss Compute, Backward Pass, Gradients, Optimizer Update. Include a checkpointing icon stack, a “Model Precision” box mentioning FP32, FP16/BF16, FP8, and an “Optimizer State” box. Show gradient accumulation arrows and a caption explaining that during training, the model predicts outputs, computes loss, propagates gradients backward, and updates weights, repeated billions of times. 5. Inference Serving Pipeline: Create a compact serving diagram with exactly 6 stages across the top: User Request, API Gateway, Tokenizer, Scheduler / Router, Model Server (GPU), Streamed Output. Inside the panel include Dynamic Batching with exactly 3 request rows, a Model Server box showing Prefill and Decode Loop, KV Cache on GPU Memory, optional adapters, and a load balancer connecting exactly 3 model replicas labeled Model Replica 1, Model Replica 2, Model Replica N. 6. Operations, Reliability, and Safety: Include exactly 6 operational cards with icons: Autoscaling, Telemetry / Observability, Rate Limiting & Quotas, Safety Filters / Guardrails, Versioning / Rollback, Cost Monitoring. Add a note that production AI systems need strong operational tooling to remain reliable, safe, and cost-efficient. 7. Training vs Inference: Add a comparison table with exactly 6 rows: Goal, Main Bottleneck, Memory Focus, Typical Metric, Scale Pattern, Resilience Needs. Use two columns labeled Training and Inference (Serving). Training should describe learning model weights from data, distributed compute and data movement bandwidth, activations/gradients/optimizer states, tokens per second or convergence, large batch long jobs, and checkpointing/fault tolerance. Inference should describe generating useful responses for users, latency and throughput, model weights plus KV cache, latency and tokens per second, many short requests, and high availability/graceful degradation. 8. Key Concepts right column: Create a tall right sidebar titled Key Concepts containing exactly 5 lettered cards: A. Batch Size, B. Sequence Length / Context Window, C. KV Cache, D. Throughput vs Latency, E. Parameters / Weights / Activations. Card A should define batch size and show small batch versus large batch with token/person icons. Card B should show prompt tokens and long context as token blocks labeled T1, T2, T3, T4, …, Tn. Card C should show prompt tokens feeding a purple cylindrical KV Cache, then a new token reading from cache. Card D should show exactly 2 gauges: Throughput and Latency. Card E should show weights and activations as blue and purple grids connected by multiplication. At the bottom of the sidebar add a small “Prefill vs Decode” note explaining prefill processes the full prompt and decode generates one token at a time using the KV cache. Footer: Add a bottom navigation strip with the sequence “DATA → TRAINING → INFERENCE → VALUE,” a small circular rocket/compass-style icon at left, and a closing quote: {argument name="footer quote" default="Powering intelligent systems with data, compute, and engineering excellence."} Visual style: Dense corporate technical infographic, crisp vector and semi-3D icons, glowing cyan outlines, subtle gradients, volumetric light, small schematics, miniature charts, and clean serif title typography with modern sans-serif labels. The color palette should be {argument name="color palette" default="deep navy, electric blue, cyan, violet, white, and small amber accents"}. Constraints: Use exactly 8 numbered main sections, exactly 5 key concept cards, exactly 4 GPU nodes, exactly 6 training-step stages, exactly 6 inference stages, exactly 6 operations cards, and exactly 6 training-vs-inference table rows. Keep all visible text in English, avoid watermarks, avoid brand logos, and maintain high readability despite the dense layout.
立即使用此灵感
相似灵感推荐
查看更多
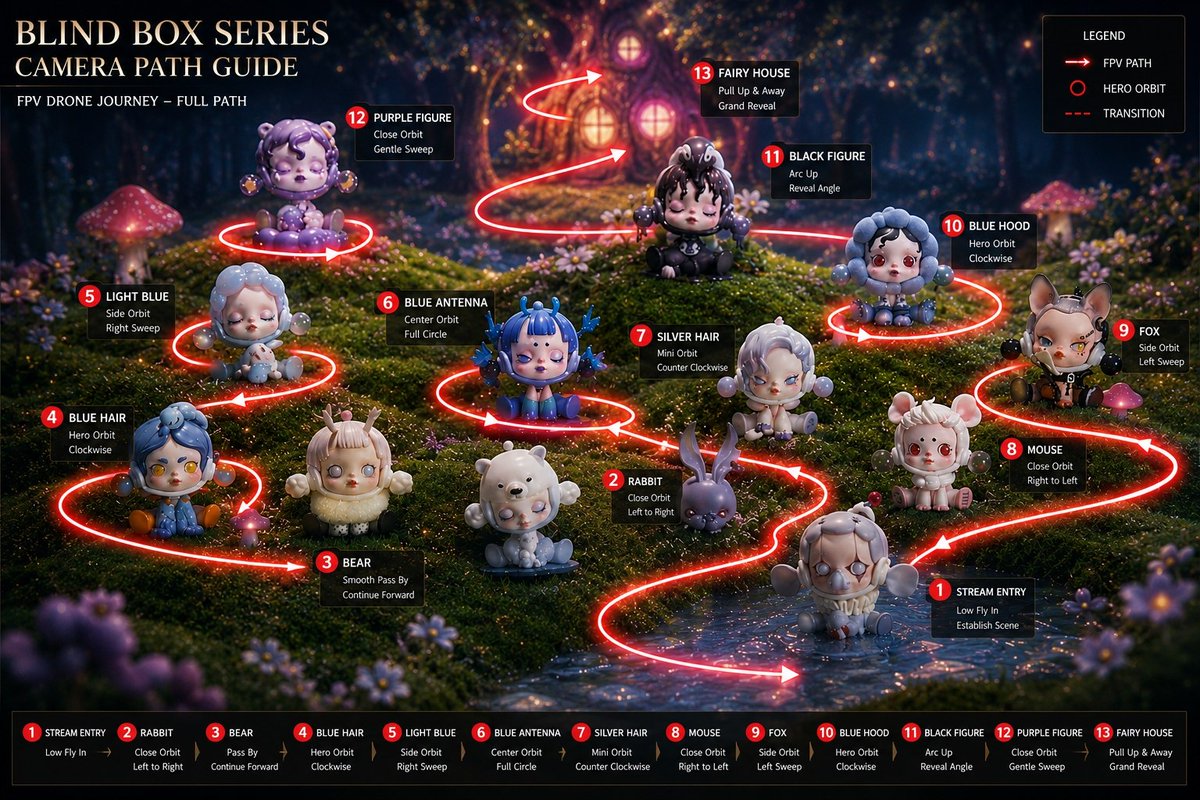
信息图 / 教育视觉 - 盲盒相机路径指南
#信息图
#UI 设计
#电影感
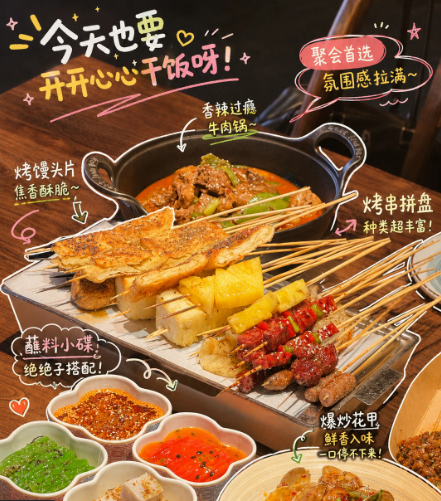
信息图 / 教育视觉 - 标注版中国烧烤美食海报
#信息图
#海报
#竖版 9:16
信息图 / 教育视觉 - GPT Image 2 漫画规划信息图
#信息图
#日系
#人像
信息图 / 教育视觉 - 3D 笔记本世界旅行海报
#信息图
#人像
#风景
信息图 / 教育视觉 - 动漫AI课程演示缩略图
#信息图
#日系
#UI 设计
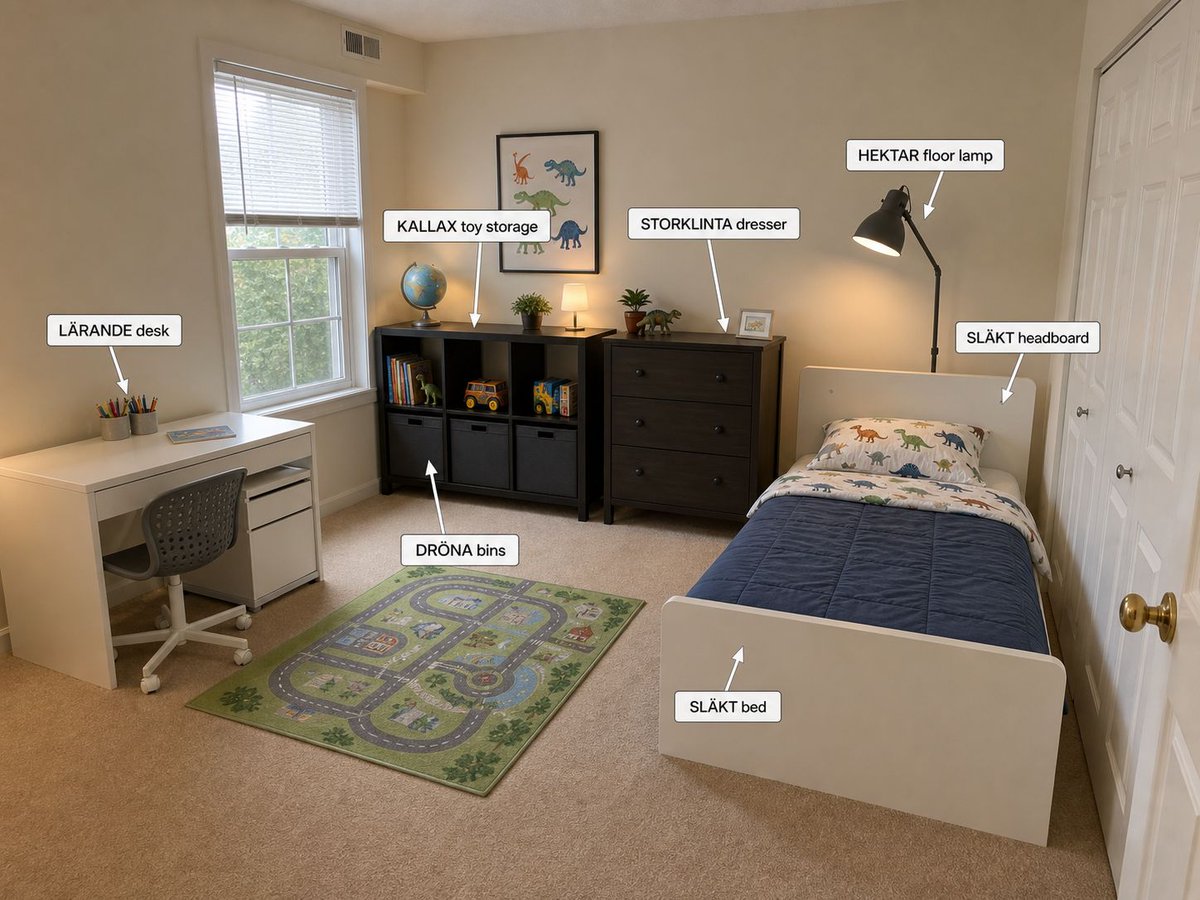
信息图/教育视觉 - 带标注的宜家儿童卧室设计
#信息图
#UI 设计
#风景
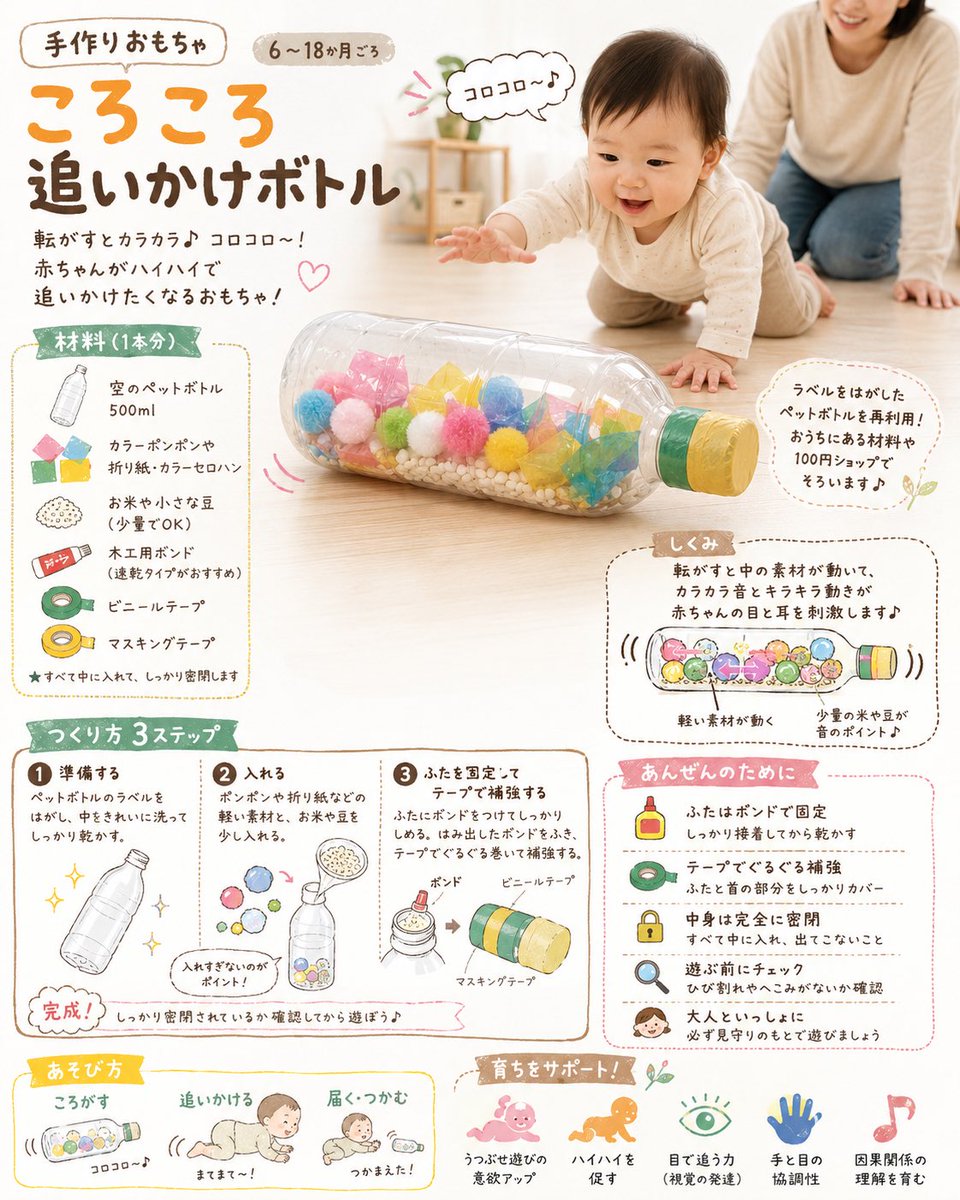
信息图/教育视觉 - DIY婴儿玩具概念图
#信息图
#电商
#示意图
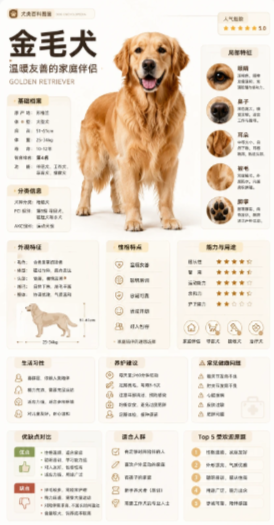
信息图 / 教育视觉 - 金毛百科卡片
#信息图
#海报
#人像
信息图 / 教育视觉 - 英国短毛猫百科卡片
#信息图
#竖版 9:16
#人像
信息图 / 教育视觉 - 分解纪念碑糕点艺术
#信息图
#人像
#UI 设计